01 / ContextThe problem it addresses
Built because conventional server dashboards often lacked enough control, visibility, security, or infrastructure context. Delivers central observability, server health visibility, topology understanding, system status, restricted account access, secure administration, and easy infrastructure monitoring.
02 / BuildWhat the project does
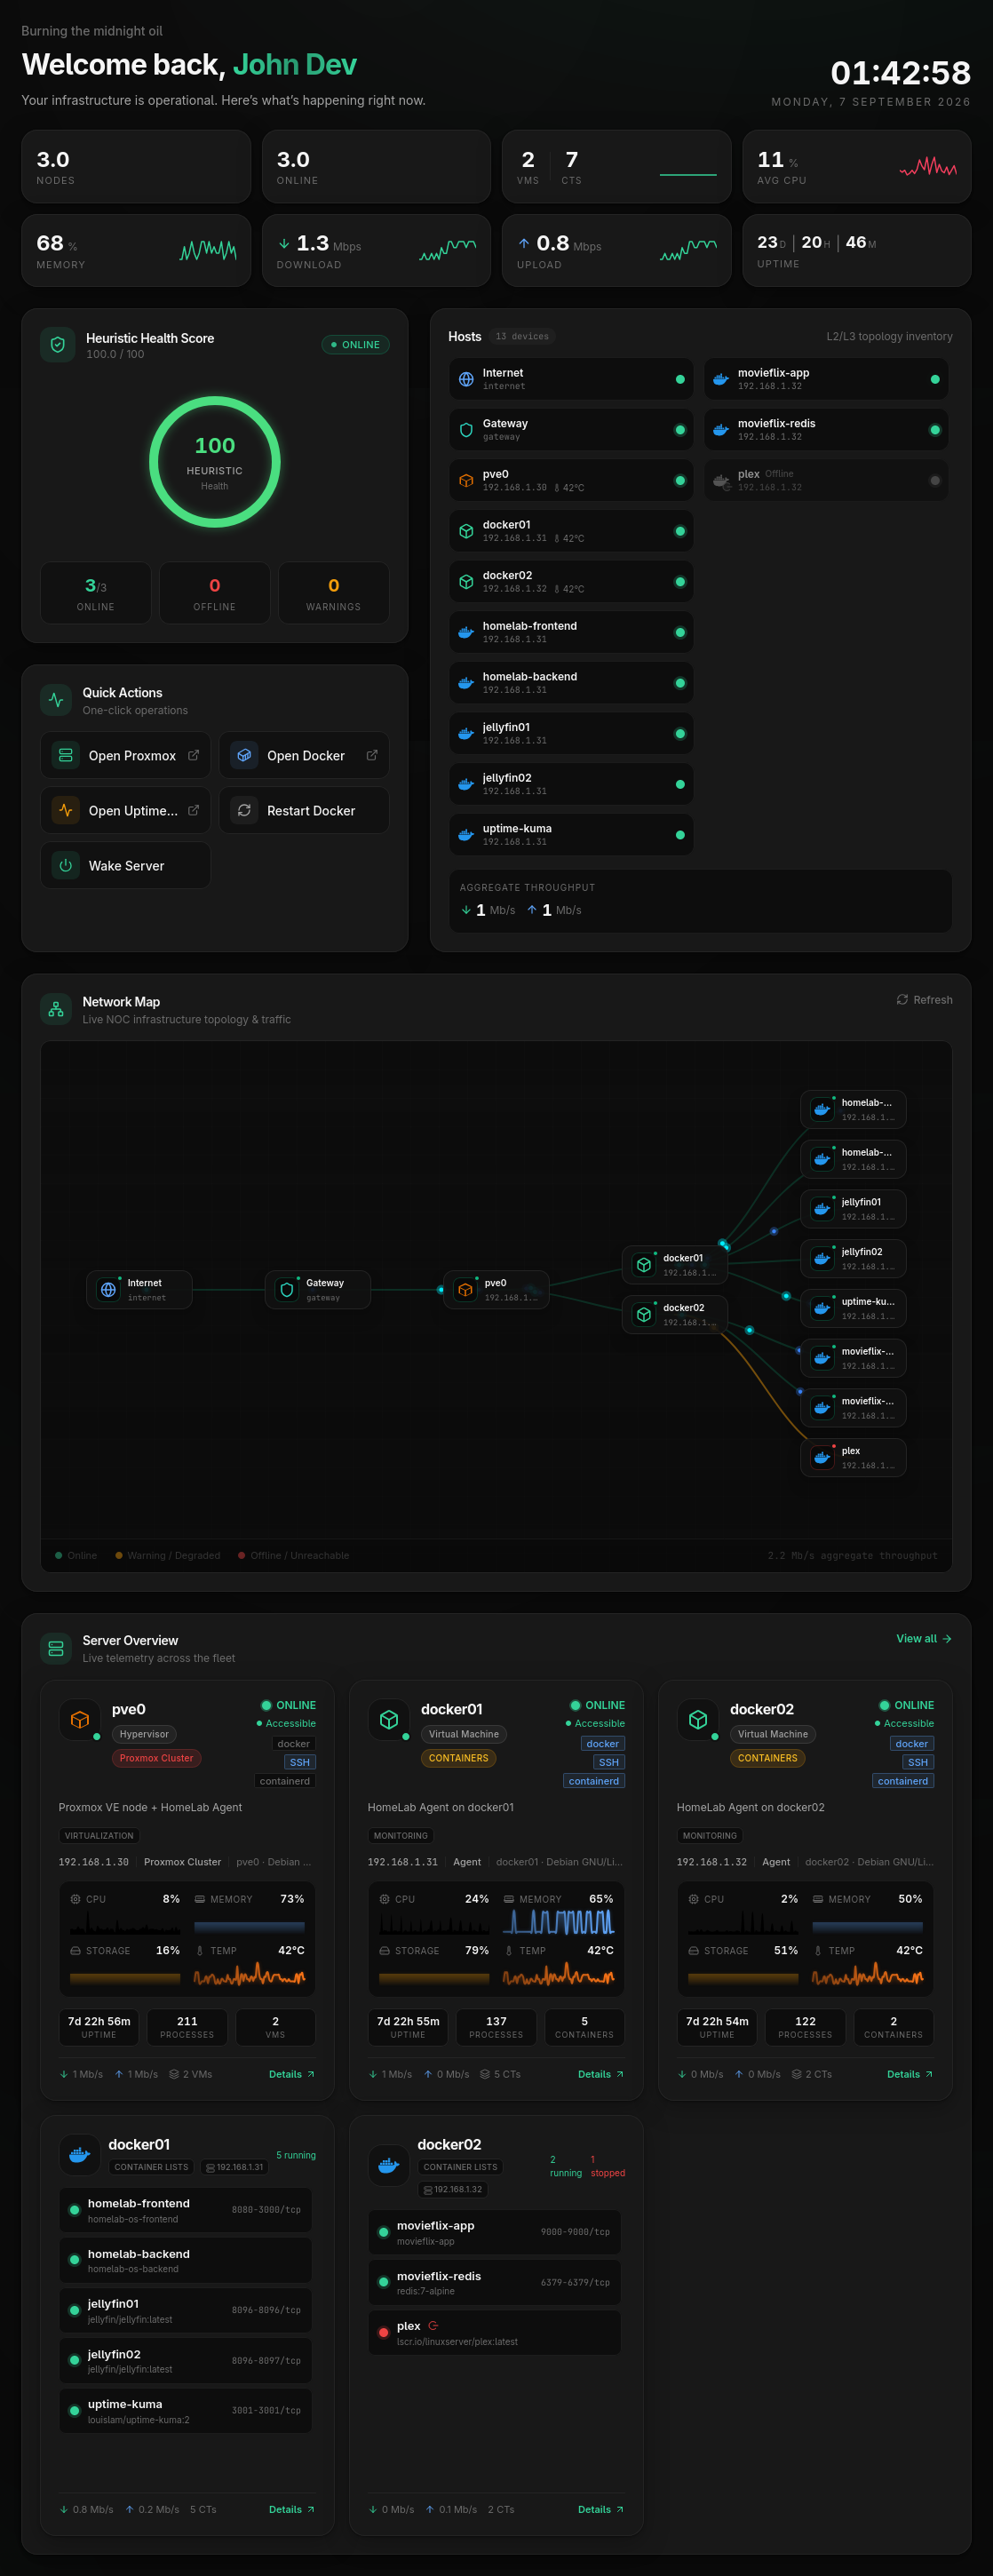
Nexora Lab turns your infrastructure into a live Network Operations Center. The dashboard renders a fleet of servers with CPU, memory, storage, temperature and network telemetry, a network topology map, an alert feed, and deep per-server detail views — all updated in real time. It ships in demo mode with a simulated six-host fleet and can switch to live Proxmox VE data and optionally Nexora Agent integrations through environment configuration.
03 / Design decisionDesign decision
A simulated fleet keeps the interface explorable without exposing private infrastructure. Environment configuration switches the same dashboard to live Proxmox and optional agent data.