The problem it addresses
Makes tracking expenses visual and immediate. The whole app runs client-side in the browser, so anyone can try it live without any backend, database, or setup.

12 / Web
demoAn interactive expense-tracking dashboard with Chart.js visualization — try it live right in the browser.
Live Demo — Data stays in your browser
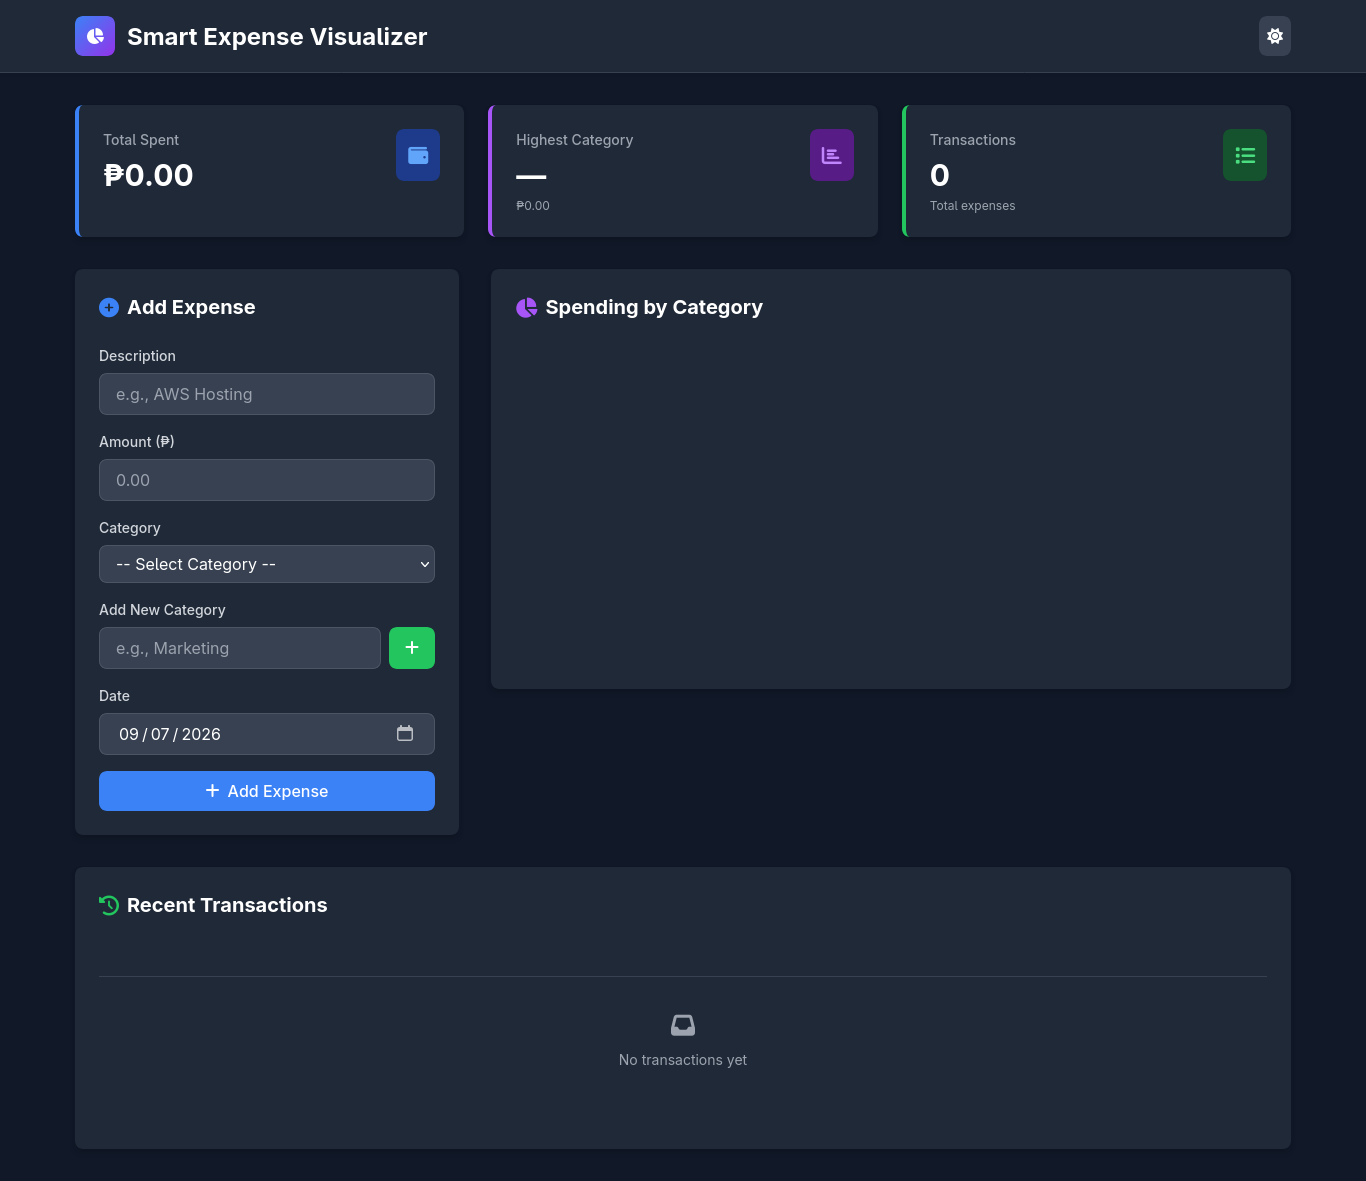
Makes tracking expenses visual and immediate. The whole app runs client-side in the browser, so anyone can try it live without any backend, database, or setup.
A browser-based expense-tracking demo using JavaScript, Tailwind CSS, and Chart.js. Add expenses, organize them by category, and watch a live pie chart update as you go. All data is persisted only in your browser via localStorage — no server or database — which makes it perfect as a hands-on portfolio demo. Includes dark/light theme, spending summary cards, custom categories, and a sortable transactions table.
The experience is intentionally serverless. Entries stay in the current browser, making the interaction safe to explore without an account or shared database.